Spread.Sheets Documentation
Configuring Chart Title, Chart Area and Plot Area
Spread.Sheets Documentation > Developer's Guide > Customizing the Appearance > Understanding Chart > Configuring Chart Elements > Configuring Chart Title, Chart Area and Plot Area

You can configure the following basic components of a chart:

  1. Chart Title

    Chart Title refers to the name given to the chart. You can add a title to your chart using the title method in Chart class. You can set a custom text for your chart; define its font family, change its font size and font color etc. using the various options available in this method.

  2. Chart Area

    Chart Area refers to the large region occupied by a chart in the worksheet. It includes all other chart elements. The chartArea method in the Chart class can be used to customize the chart area of a chart.

  3. Plot Area

    Plot Area refers to the region that represents the plotted data in a chart.

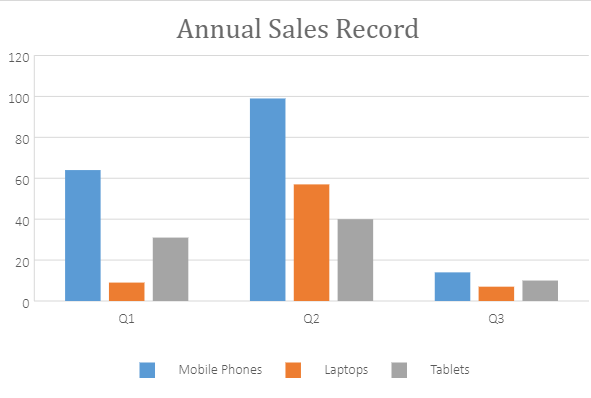
A chart with customization of basic components is shown below:


Using Code

This code shows how to configure basic components of a chart.

JavaScript
Copy Code

var sheet = spread.getActiveSheet();

sheet.suspendPaint();

            //prepare data for chart
            sheet.setValue(0, 1, "Q1");
            sheet.setValue(0, 2, "Q2");
            sheet.setValue(0, 3, "Q3");
            sheet.setValue(1, 0, "Mobile Phones");
            sheet.setValue(2, 0, "Laptops");
            sheet.setValue(3, 0, "Tablets");
            for (var r = 1; r <= 3; r++) {
                for (var c = 1; c <= 3; c++) {
                    sheet.setValue(r, c, parseInt(Math.random() * 100));
                }
            }

 //add chart
            var chart = sheet.charts.add('Chart1', GC.Spread.Sheets.Charts.ChartType.columnClustered, 350, 20, 600, 400, "A1:D4");

//Get Chart object added to the sheet
            var chart = sheet.charts.all()[0]; // get chart by index         

//Configure ChartArea
            var chartArea = chart.chartArea();
            chartArea.backColor = "white";
            chartArea.fontSize = 14;
            chart.chartArea(chartArea);

//Configure chart title
            var title = chart.title();
            title.text = "Annual Sales Record";
            title.fontFamily = "Cambria";
            title.fontSize = 28;
            title.color = "#696969";
            chart.title(title);